
Summary Tab
Chapter 7.1: Viewing the Summary Tab
Your primary dashboard for an individual node's settings and real-time health.
ℹ️ Individual Server Management
Available to: All user roles
Scope: POD level (individual server focus)
Permissions:
POD/Org Admin: Full control including configuration changes
Viewer roles: Monitor-only access (cannot modify settings)
Overview: The Node's Command Center
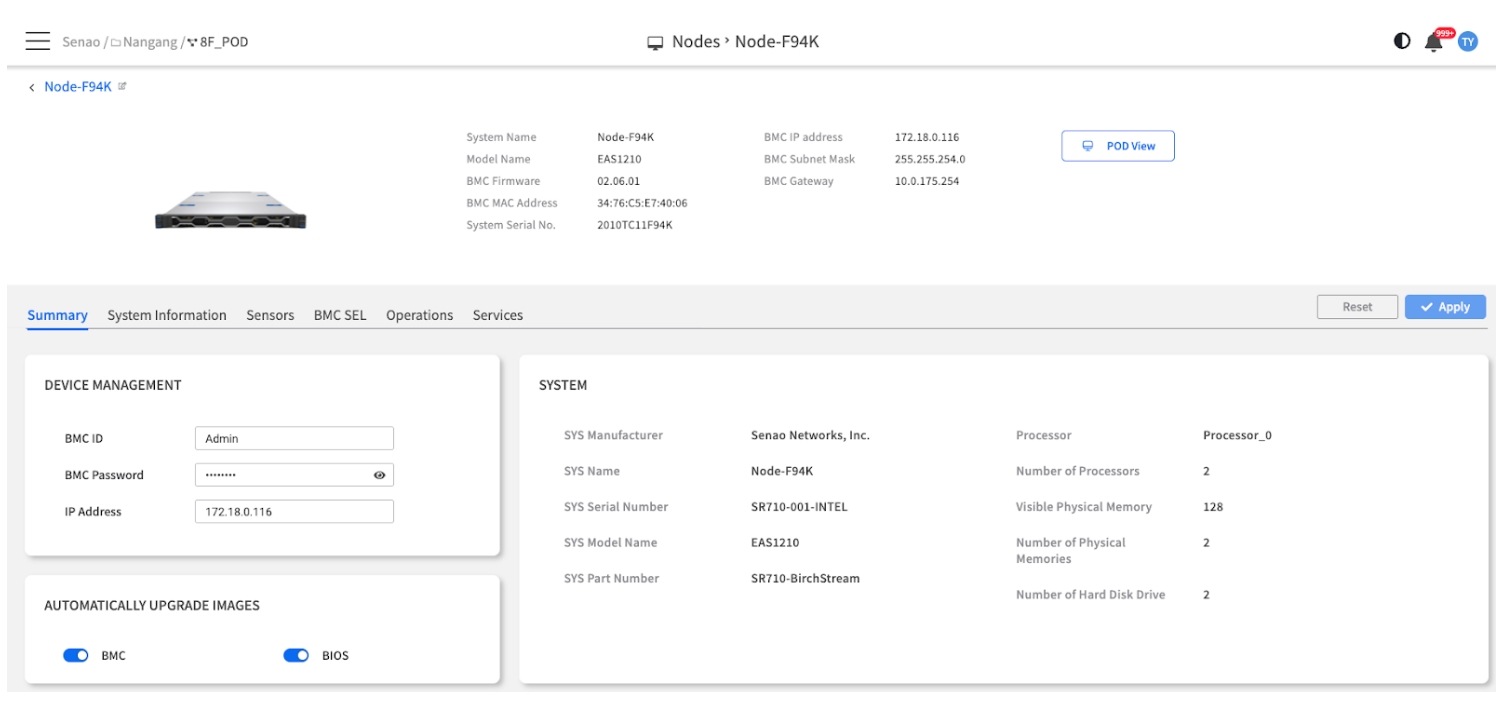
The Summary tab is the most important page for the day-to-day management of a single node. This is your command center for a specific machine, combining three key functions into one view:
Identity Check: Quickly verify the node's name, model, and network settings.
Live Health Monitoring: View real-time graphs of the node's environmental health (fans, temperature, voltage, and power).
Core Configuration: Adjust the node's essential management settings, like its BMC credentials and firmware update policy.
Navigation Context: You access this tab by selecting a specific node from the Node List and clicking "Details" or using the individual node action menu.
Task 1: Verifying Node Identity & Hardware
The top half of the screen provides a quick-reference "digital nameplate" for the node, showing its key hardware and management identifiers. This is essential for confirming you are working on the correct machine and for asset management tasks.
Header Information
This panel provides at-a-glance identification for the node you are currently managing.
System Name
The Node's Alias: The user-defined name of this node within EDCC.
Quick identification and inventory management
Model Name
Hardware Model: The specific EnGenius node model (e.g., EAS1210). Crucial for ensuring you use the correct firmware.
Firmware compatibility and hardware planning
BMC Firmware
Management Firmware Version: The current firmware version of the BMC. Important for security and feature audits.
Security compliance and feature availability
BMC MAC Address
Unique Network ID: The unique MAC address of the BMC. Essential for network troubleshooting and DHCP reservations.
Network configuration and troubleshooting
System Serial No.
Unique Hardware ID: The unique serial number of the node's hardware. This is the primary identifier for support tickets and asset tracking.
Support tickets and warranty management
BMC IP Address
Management IP: The current management IP address of the BMC. This is the address EDCC uses to communicate with the node.
Network connectivity and management access
BMC Subnet Mask
Network Subnet: Defines the node's local network, determining which other IPs are on the same subnet.
Network configuration and troubleshooting
BMC Gateway
Network Gateway: The router address for the node's BMC, enabling communication outside of its local subnet.
Network connectivity and remote access
Asset Management Tip: The System Serial No. is your most critical identifier for vendor support, warranty claims, and hardware inventory tracking
System Information Panel
This is a read-only inventory of the node's key computing components, providing a quick hardware audit without needing to go to the more detailed System Information tab.
SYS Manufacturer
The manufacturer of the server system (e.g., EnGenius).
EnGenius
SYS Model Name
The specific model name or SKU of the system.
EAS1210, EAS2210
SYS Serial Number
The main serial number for the entire system chassis.
X123456789
SYS Part Number
The manufacturer's part number for the system.
SKU-123-456
Processor(s)
The model(s) of the installed CPUs. Helps verify the node's compute capabilities.
Intel Xeon 6 (P-core/E-core variants)
Physical Memory
The total amount of installed RAM. A key specification for performance and capacity planning.
32GB, 64GB, 128GB configurations
Number of Hard Disk Drive
The number of detected storage drives. Helps verify the node's storage configuration.
12-24 drives (depending on model)
Task 2: Monitoring Real-time Sensor Data
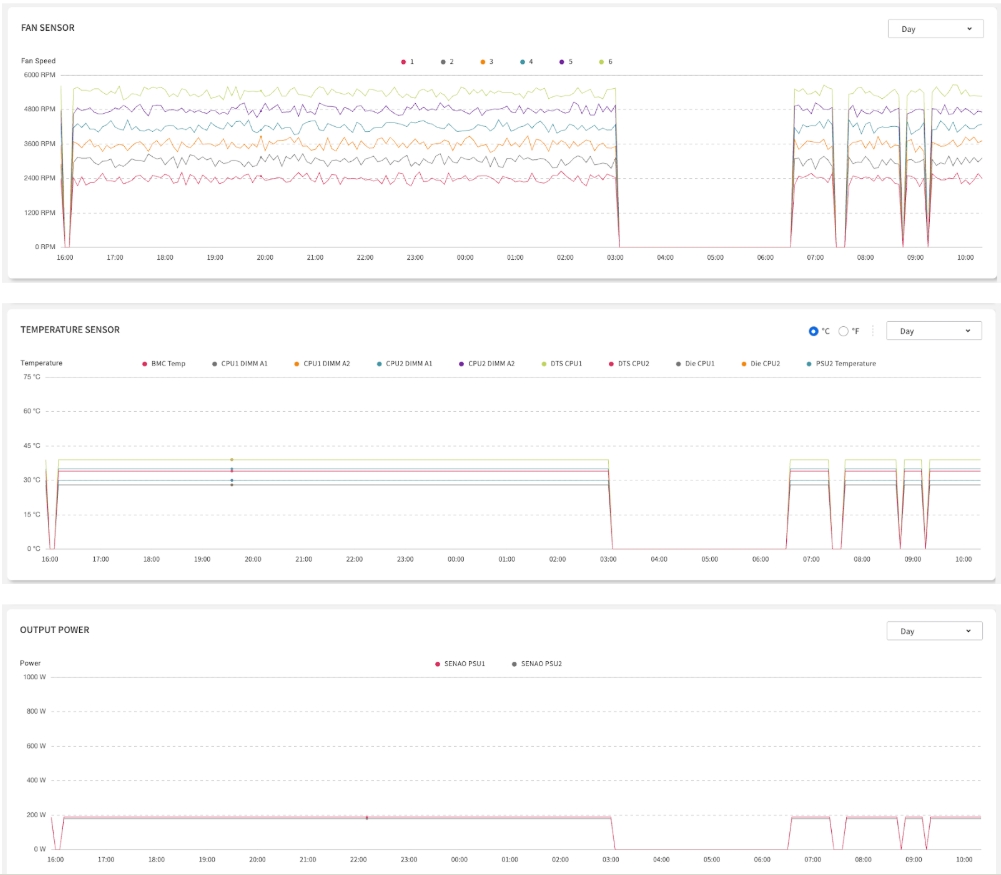
These graphs provide a live feed of the node's environmental health, collected directly from the BMC. They are your primary tool for spotting performance trends and potential hardware issues over time.
Important: Refresh for Live Data
The sensor data refreshes when the page is first loaded. For the most up-to-the-minute data, perform a manual browser refresh (F5).
Interpreting the Sensor Charts
Voltage Sensor Chart
Tracks the stability of key voltage rails (e.g., 12V, 5V, 3.3V) crucial for components.
Stable voltage readings within tight, predefined tolerances.
Significant drops, spikes, or unstable fluctuations, which can indicate a failing PSU or motherboard issue.
Fan Sensor Chart
Tracks the speed (RPM) of all fans.
Consistent RPM values across all fans.
Sudden drop to zero = fan failure or node shutdown.
Temperature Sensor Chart
Monitors temperatures from critical components.
Normal operating ranges per component.
Sustained high temps = cooling issues or high workload.
Output Power Chart
Shows real-time power consumption (watts) for each PSU.
Both PSUs active and sharing the load in redundant systems.
One PSU drops to zero = PSU failure or redundancy issue.
Sensor Monitoring Best Practices
Daily Health Check:
Voltage Status: Verify all voltage rails are stable and within normal range.
Fan Status: Verify all fans are operational (non-zero RPM).
Temperature Trends: Look for unusual temperature spikes or consistently high readings.
Power Distribution: Confirm PSU redundancy is working (both PSUs showing load).
Trend Analysis:
Compare Baselines: Note normal operating ranges for your environment.
Correlate Events: Match sensor changes with workload or environmental changes.
Proactive Monitoring: Use sensor data to predict hardware maintenance needs.
💡 Troubleshooting Tip: Sudden sensor drops to zero (for Fans or Power) often indicate hardware failures, while unstable voltage readings or gradual temperature increases may suggest environmental issues or impending component failure.
Troubleshooting Tip: Sudden sensor drops to zero (for Fans or Power) often indicate hardware failures, while unstable voltage readings or gradual temperature increases may suggest environmental issues or impending component failure.
Task 3: Configuring Node-Specific Settings
Overview: This is where you can adjust core access credentials and override POD-level policies for this specific node. All changes made in this section must be saved by clicking the Apply button in the top-right corner.
Admin Permission Required: Configuration changes require POD Admin or Organization Admin role.
Device Management Panel
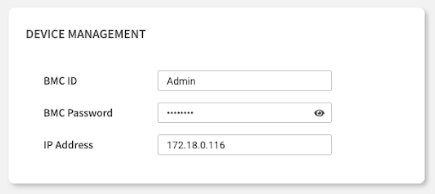
This panel allows you to configure the core access credentials EDCC uses to connect to the node's BMC.
BMC ID / Password
The Login Credentials: The username and password EDCC uses to log in to this node's BMC.
⚠️ Critical: If you manually change the password on the BMC's web interface, you must update it here, or EDCC will lose management access.
IP Address
The Management Address: The management IP address of the node's BMC.
Network Impact: Changing this value will directly reconfigure the BMC's network settings.
Security Best Practice: Use strong, unique passwords for BMC access and update them regularly according to your security policy.
Automatically Upgrade Images Panel
Overview: This panel enables or disables automatic firmware updates for this specific node, allowing you to make it an exception to the POD-wide policy.
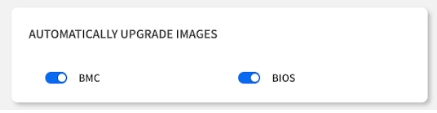
BMC Firmware Toggle
Include/exclude this node from automated BMC firmware updates.
Exclude critical production systems during maintenance windows.
BIOS Firmware Toggle
Include/exclude this node from automated BIOS firmware updates.
Prevent updates on systems with specific BIOS requirements.
How it Works:
Enabled: This node will be included in the automated updates scheduled for the entire POD.
Disabled: This node will be skipped, even if a new firmware version is available.
When to Use:
Exclude Critical Systems: Temporarily exclude a sensitive production node from a scheduled update.
Prevent Test Updates: Stop a development node from being automatically upgraded.
Maintenance Windows: Exclude nodes during planned maintenance periods.
Compliance Requirements: Maintain specific firmware versions for regulatory compliance.
Planning Tip: Use node-level overrides strategically to maintain system stability while still benefiting from automated updates for non-critical systems.
Chapter Summary & Key Takeaways
It's a 3-in-1 Tool: Use it to Identify, Monitor, and Configure a single node.
Check Serial Number: The System Serial No. is your most important identifier for support and asset management.
Monitor for Drops: In the sensor charts, watch for sudden drops to zero (Fans, Power) or fluctuations (Voltage), as they usually indicate a hardware issue.
Click Apply: No configuration changes take effect until you click the Apply button.
Refresh for Real-time Data: Manual browser refresh (F5) is required to get the latest sensor readings from the BMC.
Permission Awareness: Configuration features require Admin role - Viewers can only monitor.
What's Next:
Chapter 7.2 will explore the System Information tab, where you'll find a comprehensive hardware inventory and detailed component specifications.
💡 Daily Routine: Make the Summary tab your first stop when investigating individual node issues—it provides the perfect balance of identification, monitoring, and quick configuration access.