
Sensors
Chapter 7.3: Monitoring Hardware Sensors
Your toolkit for precise, in-depth hardware health diagnostics.
ℹ️ Hardware Sensor Monitoring
Available to: All user roles
Scope: Individual node level
Permissions: Read-only for all users
Data Source: Real-time readings from BMC sensors via Redfish protocol
Overview
The Sensors tab is your tool for detailed hardware diagnostics. While the Summary tab's graphs help you spot trends over time, this page provides the exact, real-time numerical values and the official manufacturer-defined operating thresholds for every sensor in the node. This is the difference between seeing a fever chart and reading the exact temperature on a digital thermometer.
All data here is polled directly from the Baseboard Management Controller (BMC), making it completely independent of the operating system. Use this read-only page to answer one critical question: "Is this component currently operating within its safe, predefined limits?"
Always Get the Latest Data
The sensor data is a snapshot from when the page was loaded. To get the most up-to-the-minute readings from the node's BMC, remember to perform a manual browser refresh (F5).
How to Triage a Sensor's Health
The tables on this page are designed for quick and accurate assessment. To interpret any sensor reading, follow this three-step process.
Three-Step Health Assessment Process
Check the Status: Look at the color-coded dot first for an immediate health summary.
Read the Current Value: See the real-time measurement being reported by the component.
Compare with Thresholds: Verify where the current value falls within the hardware's official safe operating range.
Sensor Table Column Reference
Status
Your At-a-Glance Health Indicator: Good is normal. Warning or Critical means the sensor has crossed a predefined threshold and requires immediate attention.
First check - prioritize non-green statuses
Current Value
The Real-Time Reading: The precise, real-time measurement from the sensor (e.g., Volts, RPM, °C).
Exact measurement - compare against expected ranges
Thresholds
The Official Safe Operating Limits: These read-only values are defined by the hardware manufacturer. A Current Value outside these boundaries triggers a Status change.
Reference ranges - understand normal vs. abnormal
Diagnostic Priority: Always start with Critical status sensors, then Warning, then verify Good sensors for baseline understanding.
Sensor Category Deep Dive
Each category of sensors provides insight into a different aspect of the node's physical health.
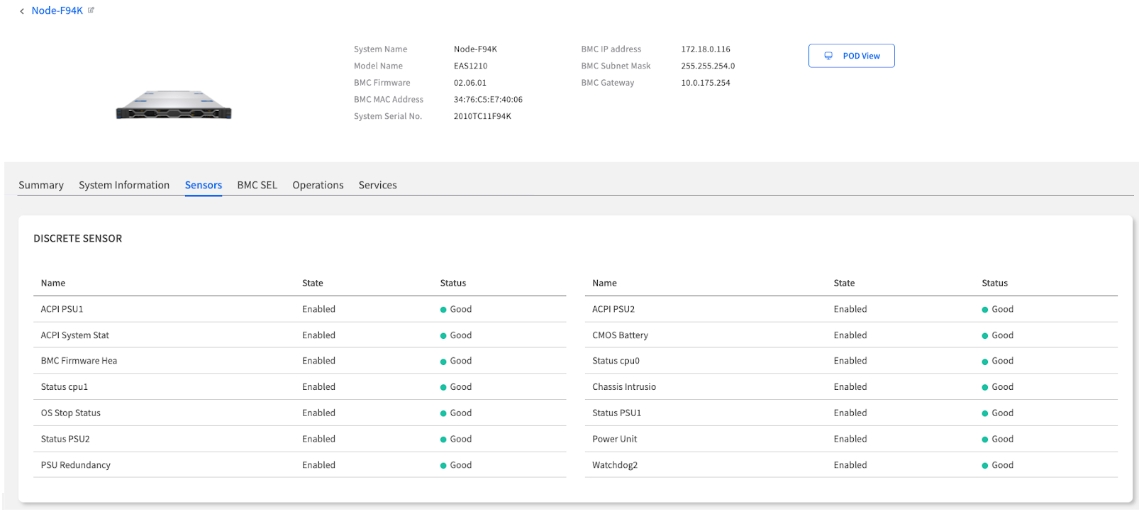
Discrete Sensors
These sensors act as simple binary (on/off, true/false) indicators for various system states. They are excellent for quick, definitive checks.
Common Examples:
Chassis Intrusion: Detects if the case has been opened
PSU Redundancy: Confirms if the redundant power supply is healthy
System Status: Overall system health indicators
🖼️ $$Image: The Discrete Sensor table, showing examples like PSU Redundancy and Chassis Intrusion status.$$
Interpretation Guide:
Good/OK: Component functioning normally
Warning: Attention required but not critical
Critical: Immediate action required
Voltage Sensors
Think of these as the "heartbeat" and "blood pressure" monitor for the node's power system. They ensure that stable and correct voltages are being delivered to sensitive components.
How to Interpret:
Normal Behavior: Current Value should be extremely stable.
Warning Signs: Significant fluctuations or drifts into Warning range.
Potential Issues: Early indicator of failing Power Supply Unit (PSU) or motherboard issue.
🖼️ $$Image: The Voltage sensor table, highlighting the Current Value in relation to the warning and critical thresholds.$$
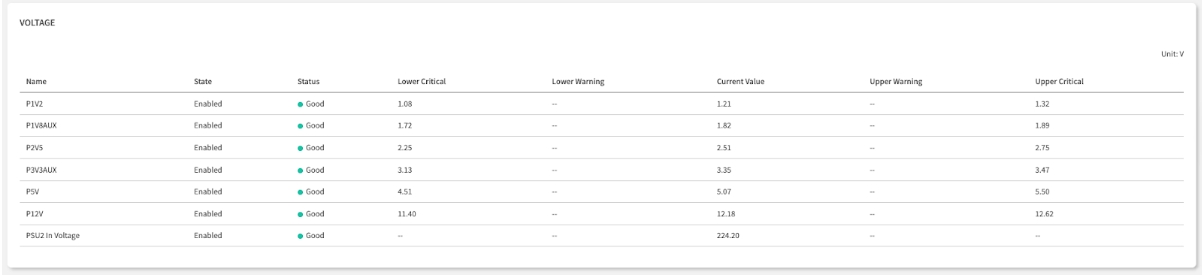
Critical Voltage Rails to Monitor:
12V Rails: Primary power distribution
5V Rails: Legacy component power
3.3V Rails: Logic and memory power
Fan Sensors
These sensors are the "respiratory check" for the node's cooling system, reporting the speed (RPM) of each fan.
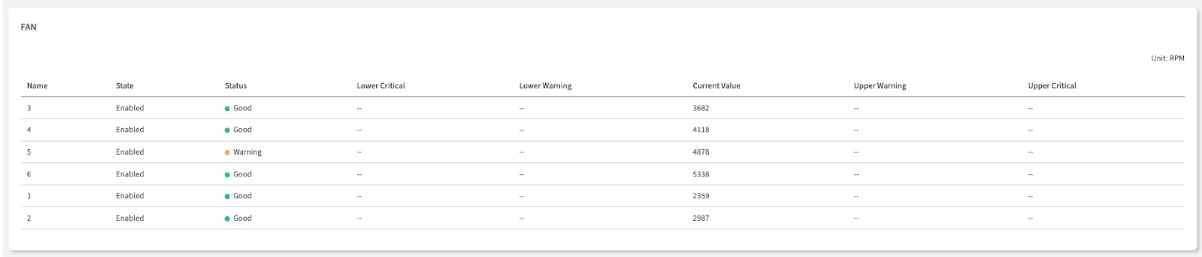
How to Interpret:
A fan's status is determined by comparing its Current Value (RPM) against its predefined Thresholds.
Good: The fan is spinning within its normal, expected RPM range.
Warning: The fan's speed is too slow (impending failure) or too fast (high heat load), crossing a Warning threshold. This requires investigation.
Critical: The fan's speed has crossed a Critical threshold. This could mean it is spinning dangerously slow, dangerously fast, or has stopped entirely (0 RPM). This state requires immediate attention.
Fan Monitoring Best Practices:
Redundancy Check: Verify multiple fans are operational.
RPM Consistency: Compare similar fans for consistent speeds.
Trend Analysis: Monitor for gradual RPM degradation.
Temperature Sensors
This is the "fever check" for your node, providing precise temperature readings from critical components. This is your primary tool for identifying and preventing overheating.
How to Interpret:
Normal Operation: Temperatures within manufacturer specifications.
High Load: Elevated but within acceptable ranges during heavy workloads.
Cooling Issues: Sustained high temperatures indicating cooling system problems.
🖼️ $$Image: The Temperature sensor table, with the °C/°F toggle visible.$$
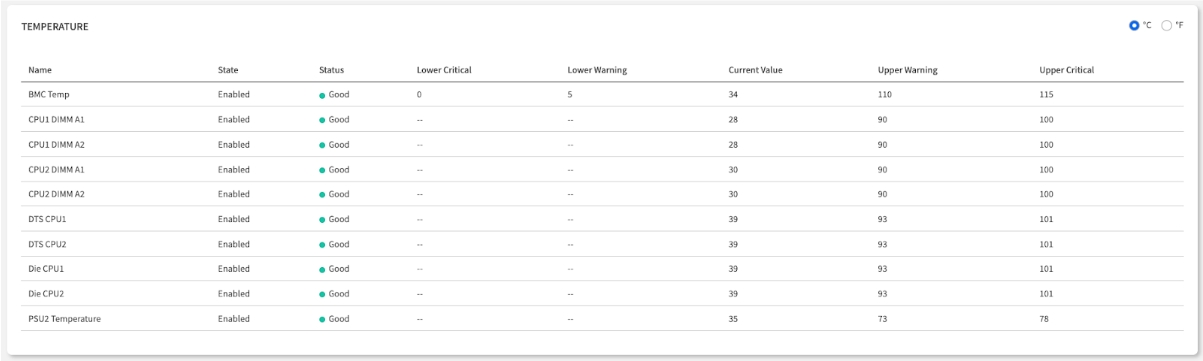
Temperature Monitoring Zones:
CPU Zones: Processor thermal management
Memory Zones: DIMM thermal monitoring
Ambient Zones: Overall chassis temperature
PSU Zones: Power Supply Unit thermal monitoring
Unit Toggle: You can switch the display between Celsius (°C) and Fahrenheit (°F) using the toggle in the top-right corner of the table.
From Sensor Alert to Actionable Insight
This page is your starting point for diagnosis. When you find a sensor with a non-good status, the goal is to turn that alert into actionable information for maintenance or support.
Your Diagnostic Workflow
Sensor Alert → Event Correlation → Evidence Gathering → Action PlanningStep-by-Step Process:
Identify the Fault: Note the full name of the sensor reporting an issue (e.g., "CPU1 DIMM A2 Temperature").
Find the Correlating Event: Immediately navigate to the BMC SEL tab. The system automatically logs a detailed event that corresponds directly to the sensor alert.
Gather the Evidence: The event log provides the precise timestamp and error details.
Take Action: This collected evidence is exactly what you need to provide to a technician for a physical inspection or to a vendor for technical support.
Documentation Template for Support
When escalating sensor issues, include:
Node Identity: System Name and Serial Number
Sensor Details: Full sensor name and current reading
Threshold Information: Operating limits and current status
Event Log Entry: Corresponding BMC SEL event with timestamp
Environmental Context: Workload and environmental conditions
Sensor Monitoring Best Practices
Daily Health Check Routine
Priority Scanning: Check for any Critical or Warning status indicators.
Baseline Verification: Note normal operating ranges for your environment.
Trend Correlation: Compare with Summary tab trends for context.
Event Correlation: Cross-reference with BMC SEL for related events.
Proactive Monitoring Strategies
Establish Baselines:
Document normal operating ranges for each sensor type.
Note typical values during different workload conditions.
Track seasonal variations in temperature readings.
Early Warning Detection:
Monitor sensors approaching warning thresholds.
Track gradual changes that might indicate developing issues.
Correlate sensor patterns across similar nodes.
Integration with Other Monitoring
Cross-Reference Points:
Summary Tab: Use graphs for trend analysis.
BMC SEL: Check for corresponding system events.
Operations Tab: Verify system operations impact on sensors.
Services Tab: Correlate with service health status.
Chapter Summary & Key Takeaways
Summary is for Trends, Sensors is for Thresholds: Use the Summary tab to see graphs over time. Use this Sensors tab to see the exact current value and compare it against the official safe operating limits.
Refresh is Required: The data is a snapshot. Always manually refresh (F5) to get the latest readings.
Your Goal is Evidence: A sensor alert is your clue. The detailed event in the BMC SEL tab is your evidence for taking action.
Follow the Workflow: Sensor Alert → Event Correlation → Evidence Gathering → Support Action.
Monitor Proactively: Establish baselines and track trends to prevent issues before they become critical.
What's Next:
Chapter 7.4 will explore the BMC System Event Log (SEL), where you'll learn to investigate the detailed hardware events that correspond to sensor alerts and system activities.
💡 Pro Tip: Create a baseline document of normal sensor readings for each node type in your environment - this makes identifying abnormal conditions much faster and more accurate.