
BMC SEL
Chapter 7.4: Managing the BMC System Event Log (SEL)
Your primary tool for investigating hardware events, tracking their resolution, and clearing critical system alerts.
ℹ️ BMC System Event Log Management
Available to: All user roles
Scope: Individual node level
Permissions:
Admin roles: Full event management including resolution status changes
Viewer roles: Read-only access to event logs
Data Source: Hardware events logged directly by BMC
Overview: The Node's Black Box Recorder
The BMC System Event Log (SEL) tab is the official hardware and service-level event log for the node, recorded directly by the Baseboard Management Controller (BMC). Think of it as the node's "black box recorder." It operates independently of the main operating system, meaning it will capture critical hardware events even if the OS has crashed.
When the Dashboard shows a CRITICAL alert, or a sensor reports an abnormal reading, this is where you come to find the detailed "who, what, and when" of the incident.
Critical Connection: Dashboard health status is directly derived from unresolved events in this log. To clear Dashboard alerts, you must resolve events here.
The Incident Response Workflow
Managing events in the SEL follows a clear, three-step process from investigation to resolution.
Investigate Event → Filter & Analyze → Resolve & ApplyStep 1: Investigate the Event
The event list is your primary source of information. Understanding how to read it is the first step in any diagnosis.
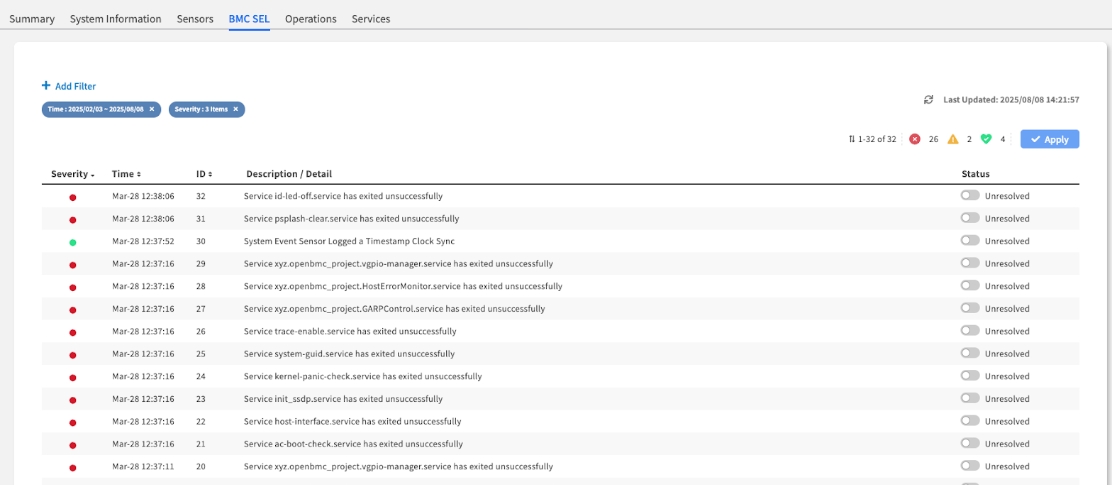
Event Table Column Reference
Severity
The Event's Impact:
Color-coded for immediate recognition.
● Critical (Red): Requires immediate attention.
● Warning (Orange): A non-critical issue that should be investigated.
● OK (Green): Informational events.
HIGHEST - Start here
Time
The Exact Timestamp:
Crucial for correlating hardware events with other system logs to pinpoint a root cause.
HIGH - For correlation
Description
The "What Happened":
A human-readable summary of the event. This is your most important clue.
HIGHEST - Key diagnostic info
Status
The Event's Lifecycle:
An interactive toggle showing if the event is Unresolved (default, requires action) or Resolved (acknowledged and handled).
HIGH - For management
Event Investigation Best Practices
Priority Reading Order:
Critical Events First: Focus on red-coded events immediately
Recent Events: Check latest timestamps for current issues
Event Correlation: Look for patterns or sequences of related events
Context Analysis: Read event descriptions for specific component details
Key Information to Extract:
Component Identity: Which specific hardware component is affected
Event Type: Hardware failure, threshold violation, or status change
Timing: When the event occurred for correlation with other activities
Severity Assessment: Impact level and urgency of response needed
Step 2: Filter to Find Specific Incidents
In a busy system or after a major event, the log can become long. Use the filter to quickly pinpoint the events you need.
Filtering Workflow
Click the + Add Filter button
Set your criteria in the dialog by Date Range or Severity
Click Apply
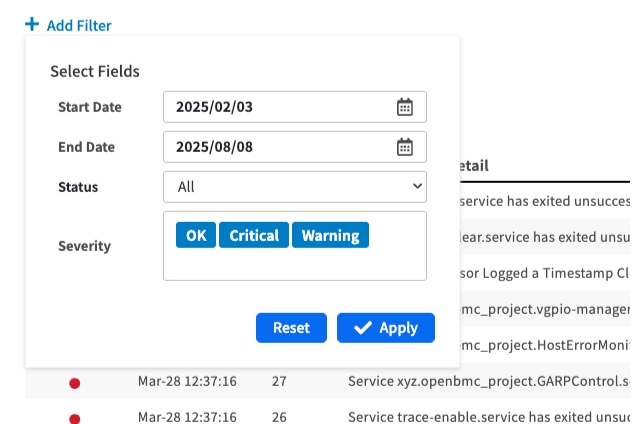
Common Filter Scenarios
Severity: Critical
Find all critical hardware failures
Power supply failures, fan failures
Date Range:
Last 24 hours
Focus on recent events
Troubleshooting current issues
Severity:
Warning + Critical
Exclude informational noise
Focus on actionable events
Specific Time Range
Correlate with known incidents
Match with maintenance windows
Advanced Filtering Strategies
Incident Investigation:
Start Broad: Begin with Critical + Warning events
Narrow by Time: Focus on timeframe when issues began
Clear and Refocus: Remove filters to see full context when needed
Regular Monitoring:
Daily Review: Filter to last 24 hours, all severities
Weekly Audit: Review unresolved events across longer periods
Maintenance Correlation: Filter around planned maintenance activities
Step 3: Manage and Resolve the Event
This is the most critical part of the workflow. After you have taken action to fix the underlying physical issue, you must update the event's status in EDCC to clear the alert.
Admin Permission Required: Event resolution requires POD Admin or Organization Admin role.
Resolution Workflow
Step-by-Step Process:
Fix the Physical Issue: Address the underlying hardware problem first
Locate the Event: Find the
Unresolvedevent you have fixedToggle Status: Click the toggle switch in the Status column to change it to Resolved
Save Changes: Crucially, click the
Applybutton in the top-right corner of the page to save this change
Critical Warning: Changes Are Not Saved Automatically
The Resolved status is not saved until you click the Apply button. If you navigate away without clicking Apply, the event will remain Unresolved, and any associated Dashboard alerts will not be cleared.
Resolution Best Practices
Before Marking Resolved:
Verify Fix: Confirm the physical issue has been actually addressed
Check Sensors: Verify related sensors now show normal readings
Test Functionality: Ensure affected component is operating properly
Document Action: Note what was done to resolve the issue (for future reference)
Resolution Workflow Safety:
One at a Time: Resolve events individually to avoid mistakes
Double-Check: Verify you're resolving the correct event
Apply Immediately: Click Apply after each resolution
Verify Results: Check Dashboard to confirm alert clearance
The Critical Link Between SEL and the Dashboard
Overview: The health status you see on the main Dashboard is directly controlled by the events in this log. Understanding this relationship is key to effective monitoring.
Dashboard Health Status Logic
Unresolved Critical Event(s)
POD Health shows CRITICAL
Resolve physical issue + mark event Resolved + Apply
Unresolved Warning Event(s)
POD Health shows WARNING
Investigate and resolve as appropriate
All Events Resolved
POD Health shows GOOD
Normal monitoring
Alert Clearance Process
Physical Issue → SEL Event → Dashboard Alert
      ↓              ↓           ↓
Physical Fix → Mark Resolved → Alert Cleared
              + Click Apply
Key Points:
If a node has even one
Unresolved Criticalevent in its SEL, the overall POD Health on the Dashboard will be flagged asCRITICALTo clear that
CRITICALstatus, you must complete the workflow: fix the hardware issue, then mark the corresponding event(s) here asResolvedand clickApplyDashboard alerts will NOT clear until both the physical issue is resolved AND the event status is updated in the SEL
Event Log Management Strategies
Daily Operations
Morning Health Check:
Review Unresolved Events: Check for any critical or warning events
Verify Recent Events: Look for new events since last check
Correlate with Dashboard: Ensure Dashboard status matches SEL status
Plan Actions: Prioritize critical events for immediate attention
Incident Response
When Dashboard Shows Critical:
Navigate to SEL: Go directly to affected node's BMC SEL tab
Identify Root Cause: Find the critical event(s) causing the alert
Gather Context: Use filters to see event timeline and related events
Plan Response: Determine physical action needed based on event details
Maintenance Coordination
Before Maintenance:
Document Baseline: Note current unresolved events
Plan Resolution: Identify which events maintenance will address
After Maintenance:
Verify Fixes: Check that physical work resolved the issues
Update SEL Status: Mark resolved events and click Apply
Confirm Dashboard: Verify Dashboard reflects successful resolution
Chapter Summary & Key Takeaways
Dashboard Alerts Start Here: An alert on the Dashboard is a symptom. The detailed event in the SEL is the diagnosis
Resolution is a Two-Step Process: You must first fix the physical hardware issue, then mark the event as
Resolvedin this interface"Apply" is the Final Step: Dashboard alerts will not clear until you have marked an event as
Resolvedand clicked the Apply buttonUse Filters: In a "log storm," the filter is your best tool for finding the initial root-cause event
Admin Rights Required: Event resolution requires Admin permissions - Viewers can investigate but cannot resolve
Direct Dashboard Connection: SEL event status directly controls Dashboard health indicators
What's Next: Chapter 7.5 will explore the Operations tab, where you'll learn to execute direct BMC commands for power management, firmware updates, and system maintenance operations.
💡 Pro Tip: Develop a habit of checking the SEL whenever Dashboard health changes - it's your fastest path to understanding what happened and what needs to be fixed.