
Event Log
Chapter 14: Centralized Event Logging
Learn how to use the main Event Log to monitor platform-wide activities and audit administrative actions.
ℹ️ Event Log Access
Available to: All user roles
Scope: Organization, Hierarchy View, POD levels
Permissions: View events from authorized PODs only
Filtering: Content automatically filtered based on user permissions
Overview: Your Platform's Security Camera and Audit Trail
The main Event Log, accessible from the primary navigation menu, is the centralized "security camera" and audit trail for the entire EDCC platform. It is a crucial, read-only tool for answering two fundamental questions:
Troubleshooting: What has been happening at the platform level? (e.g., "Why did this node go offline?")
Security Auditing: Who did what, and when? (e.g., "Who changed the settings for our production POD?")
Logs Tailored to Your Current View
The log automatically collects and displays events based on your currently selected management scope (Organization, Hierarchy View, or POD), ensuring you only see the information relevant to your current view.
Event Log vs. BMC SEL: A Critical Distinction
Before you begin, it is critical to understand the distinction between the main Event Log and the BMC SEL (Chapter 7.4). They record different types of information from different sources. Using the wrong log for your investigation can lead to confusion.
Think of it this way:
Event Log (This Chapter): The Building's Security Log. It records who enters/leaves and what they do in the building (the platform).
BMC SEL (Chapter 7.4): The Machine's Black Box Recorder. It records what is happening inside a specific machine (the node's hardware).
Data Source
The EDCC Platform itself.
The node's individual BMC.
Scope
Platform-wide (Org/HV/POD).
Single Node only.
Content Focus
Administrative & Management Actions. Answers "Who did what?"
Hardware & Firmware Events. Answers "What happened inside the node?"
Typical Events
User logins, node assignments, configuration changes, "Node Online/Offline".
Fan failures, temperature warnings, power supply issues, memory errors.
Primary Use
Security auditing, change tracking, and troubleshooting platform-level issues.
Diagnosing physical hardware problems on a specific node.
Navigating the Event Log Tabs
The Event Log is divided into two main tabs, each focusing on a different category of event, allowing you to quickly find the information you need.
Device Events: Tracking Node Lifecycle & Status
The Device Event tab focuses on the lifecycle and status of your nodes from the perspective of the EDCC platform. It tracks events related to how EDCC manages and communicates with the nodes, not the internal hardware state of the nodes themselves.
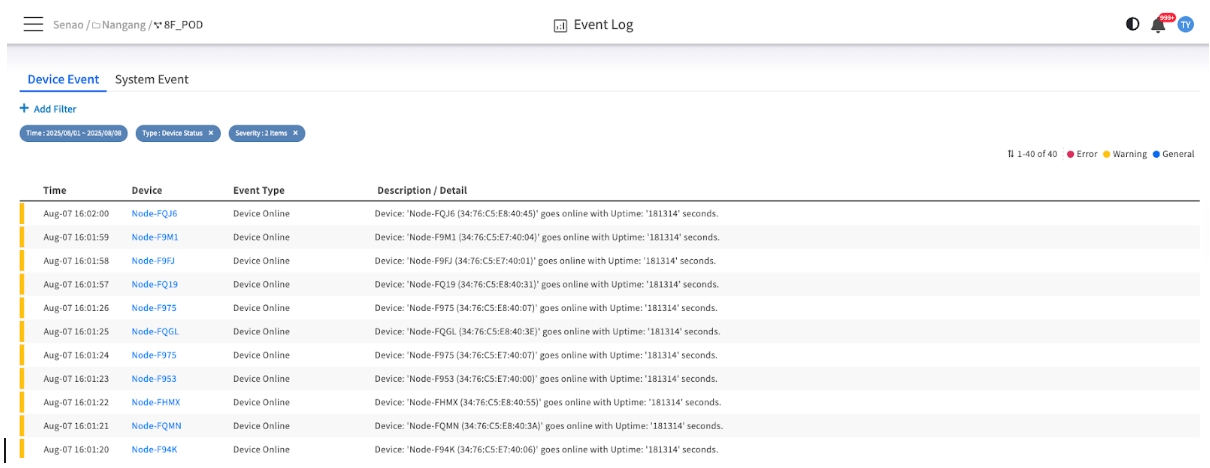
Common Device Events
Device Online
Indicates that a node's BMC is now reachable by the EDCC platform. Why it matters: This confirms successful communication and management connectivity.
Device Offline
Indicates that EDCC has lost communication with a node's BMC. Why it matters: This is a critical event that signals a potential network issue, a BMC crash, or a node power-off. It's the starting point for network troubleshooting.
Node Registered
Logs when a new node has been discovered and added to the central Inventory. Why it matters: Provides an audit trail for new hardware being introduced to the system.
Node De-registered
Logs when a node has been permanently removed from EDCC's management. Why it matters: Confirms the successful decommissioning of a node from the platform.
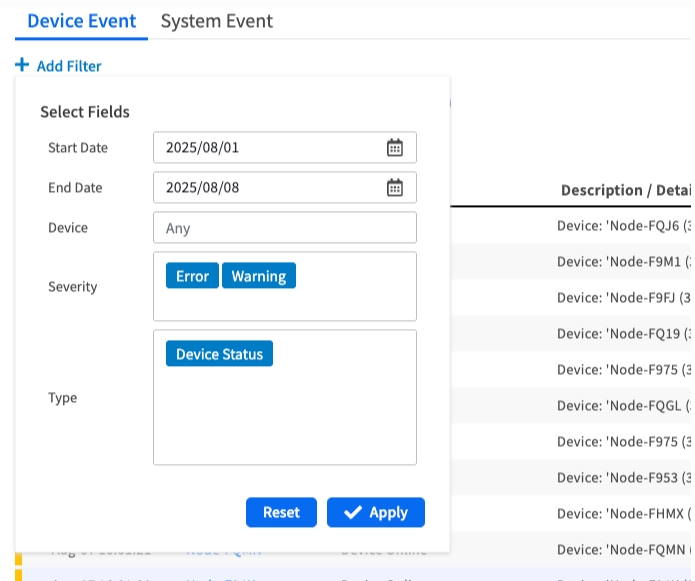
Filtering Device Events
You can use the + Add Filter button to narrow down the results based on:
Date Range: Focus on specific time periods
Device: Filter by specific node names
Severity: Filter by event importance level
Type: Filter by specific event categories
System Events: The Administrative Audit Trail
The System Event tab serves as a comprehensive, unchangeable audit trail for all significant administrative actions performed by users within the EDCC interface. This is your primary tool for security and change management.
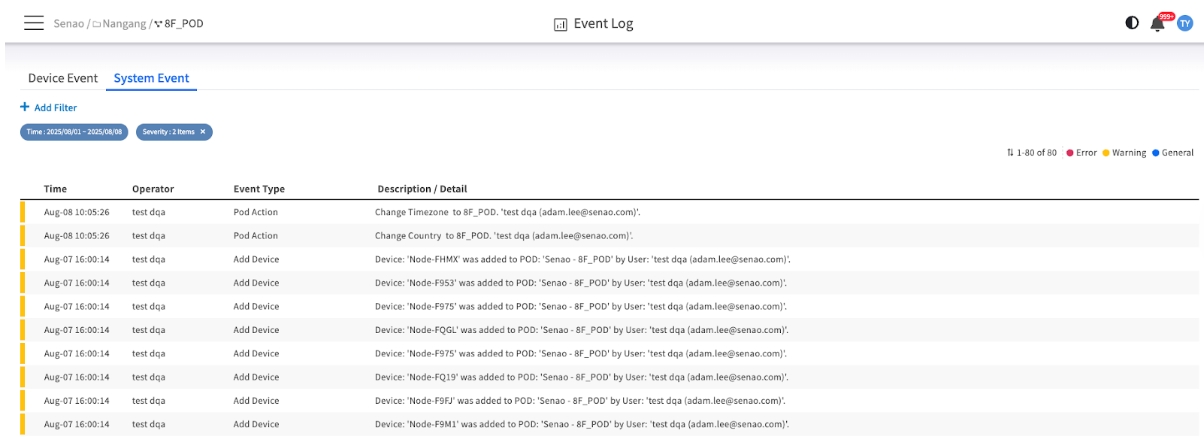
Common System Events
Add Device
Logs when a user assigns a node from the Inventory to a POD. Why it matters: Tracks when a node was officially brought under active management and by whom.
Pod Action
Records changes made to a POD's settings, such as Change Timezone. Why it matters: Crucial for auditing changes that could impact automated tasks. For example, this log entry explains why a maintenance window might have run at an unexpected time.
User Actions
Tracks user management events, such as Invite team member or Delete team member. Why it matters: Provides a clear security log of who was granted or denied access to the platform.
Login
Records every successful user login. Why it matters: Essential for security monitoring and auditing user activity.
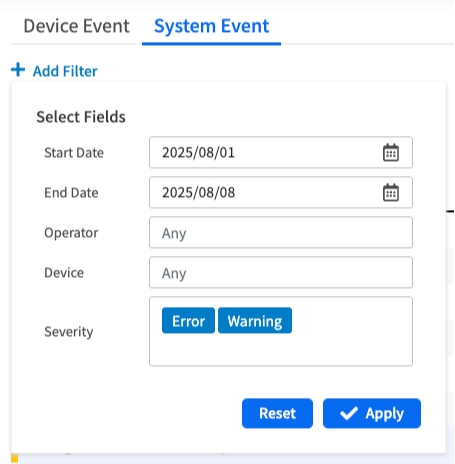
Filtering System Events
The filter for System Events allows you to search by:
Date Range: Focus on specific time periods
Operator: Filter by the user who performed the action
Device: Filter by target device or resource
Event Investigation Strategies
Troubleshooting Workflows
Node Connectivity Issues:
Check Device Events: Look for "Device Offline" entries
Correlate Timing: Match offline events with network or maintenance activities
Verify Recovery: Confirm "Device Online" events after resolution
Configuration Change Tracking:
Review System Events: Look for "Pod Action" or configuration changes
Identify Operator: Determine who made the changes
Correlate Impact: Match changes with any subsequent issues
Chapter Summary & Key Takeaways
Platform vs. Hardware: This log is for platform actions ("Who changed the POD settings?"). For hardware issues ("Why did the fan fail?"), you must use the BMC SEL on the Node Detail page
Device Events Track Connectivity: Use the Device Events tab to troubleshoot node online/offline status issues
System Events Are Your Audit Trail: Use the System Events tab to track all user actions and configuration changes for security and compliance
Read-Only: This is a monitoring and auditing tool. There are no actions to take on the events themselves
Scope-Based Filtering: Events are automatically filtered based on your current management scope and permissions
What's Next: Chapter 15 will explore Team Members management, where you'll learn to manage user accounts and permissions across your EDCC platform.
💡 Pro Tip: Use date range filters effectively - start with broader time ranges to identify patterns, then narrow down to specific timeframes for detailed investigation.