
Services Profiles
Chapter 12: Managing Services Profiles
Define and manage POD-level monitoring policies by creating flexible service profiles.
⚠️ Configuration Access Required
Required Role: POD Admin or Organization Admin
Required Scope: POD level only
Restriction: Module disabled when Organization or Hierarchy View selected
Overview: Your Monitoring Policy Headquarters
The CONFIGURE → Services Profiles page is your headquarters for defining how and how often EDCC monitors the internal management services of your nodes. Instead of a one-size-fits-all approach, this page allows you to create and manage reusable templates, known as Profiles, which give you granular control over your POD's monitoring behavior.
The core purpose of this page is to establish a standard, POD-wide monitoring policy that ensures consistency, while still allowing for flexibility.
Why Create Multiple Profiles?
Before creating profiles, it's helpful to understand why you might need more than one. Different operational scenarios call for different monitoring strategies.
Standard Operations
Use the Default profile with moderate check interval
Routine, everyday monitoring with good balance between responsiveness and system overhead
Maintenance Window
Create "Maintenance Check" profile with short check interval
Rapid feedback on system status after making changes
Troubleshooting
Design "Intensive Diagnostics" profile with high retry attempts
Apply to problematic nodes to diagnose intermittent connectivity issues
Low-Priority Systems
Create "Relaxed" profile with long check interval
Reduce monitoring overhead on non-critical lab or development systems
The 3-Step Policy Workflow
Setting up your POD-wide monitoring policy follows a logical, three-step process.
Understand Services → Build Profile Library → Activate Policy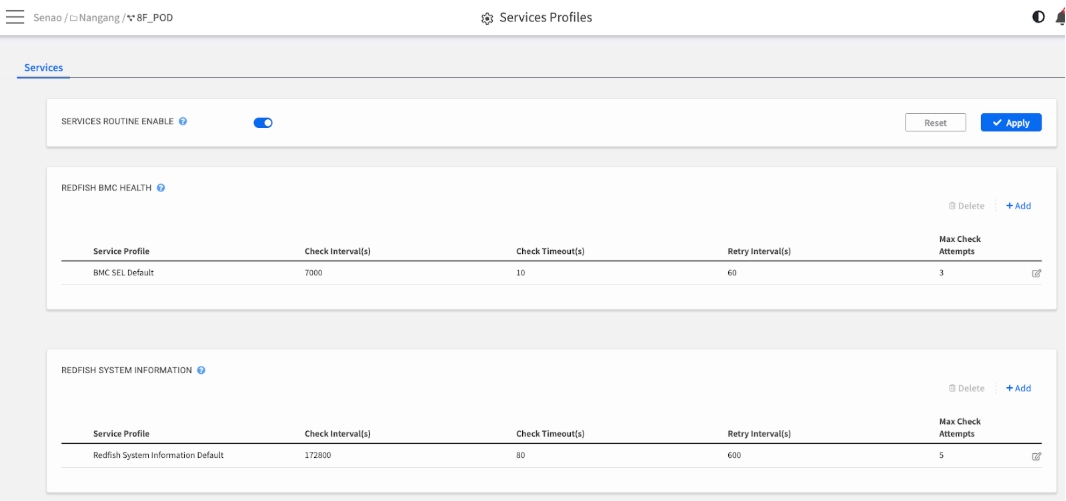
Process:
Understand the Services: Know what you are monitoring.
Build Your Profile Library: Create or edit templates (Profiles) that define how you want to monitor.
Activate the Default Policy: Use the master switch to turn the POD-wide default monitoring on or off.
Step 1: Understand the Service Categories
You can configure profiles for two distinct types of monitoring services. Understanding their different purposes is key to creating effective policies.
REDFISH BMC HEALTH
Focus: Fault Detection.
This service periodically checks the node's System Event Log (SEL) for new Critical or Warning events (e.g., fan failures, overheating). A failure here directly impacts the POD Health widget on the Dashboard. This is your primary proactive problem detection service.
REDFISH SYSTEM INFORMATION
Focus: Asset Synchronization.
This service periodically retrieves static hardware specifications (e.g., model, serial numbers, firmware versions). A failure here means the hardware list in System Information may be out-of-date, but it does not typically indicate an immediate hardware fault.
Step 2: Build Your Profile Library
This is where you create and manage your reusable monitoring templates (Profiles). You can create multiple profile options for each service category.
Managing Profiles
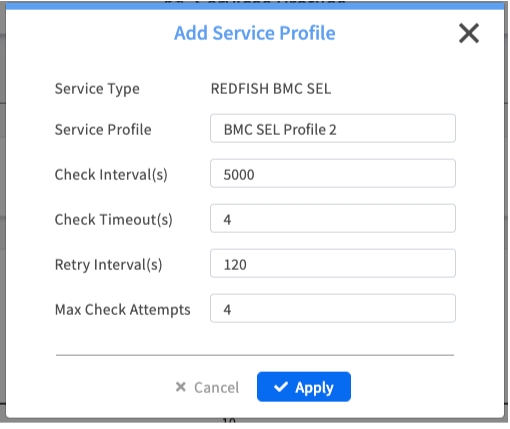
To Add a New Profile:
Click the + Add link next to the service category
Give your new profile a descriptive name (e.g., "Intensive Maintenance Check")
Configure the monitoring parameters
Click Apply to save the new profile
To Edit or Delete:
Click the pencil icon to edit any profile (including the defaults)
Click the trash can icon to delete a custom profile (defaults cannot be deleted)
Understanding the Profile Parameters
Check Interval(s)
How often to check.
A lower value (e.g., 60s) means faster detection of new events, but it also creates more network traffic and a higher load on the nodes' BMCs. A higher value is less resource-intensive but has a longer detection time.
Check Timeout(s)
How long to wait for a response.
A shorter timeout will quickly identify unresponsive BMCs, but might generate false positives on a heavily congested network. A longer timeout is more tolerant of slow networks but will take longer to detect a truly offline BMC.
Retry Interval(s)
How long to wait between retries.
This is the "cool-down" period after a failed check before trying again.
Max Check Attempts
How many times to retry.
The maximum number of times EDCC will retry a failed check before marking the service as down and generating an alert. A higher number makes the check more resilient to temporary network blips.
Step 3: Activate POD-Wide Default Monitoring
After you have created your library of custom profiles (like "Intensive Check"), your final step is to activate the default monitoring for the entire POD.
Process:
Enable the Master Control: Turn on the main
SERVICES ROUTINE ENABLEtoggle at the very top of the page. This is the master "on/off" control for the POD.Save Everything: Click the
Applybutton in the top-right corner to save your changes.
Important: Understanding This Logic
Turning the master SERVICES ROUTINE ENABLE toggle ON performs one specific action:
It activates the "Default" profiles (e.g., "Default" for BMC Health, "Default-Info" for System Info) for all nodes in the POD.
⚠️ This action DOES NOT allow you to select a POD-wide "active profile."
To use any of the custom profiles you created (like "Intensive Maintenance Check"), you must go to the individual node's settings (as explained in the next section).
POD-Wide Policy vs. Individual Node Overrides
EDCC uses a hierarchical approach to service monitoring: a general rule for all, with the flexibility for exceptions.
The Rule: POD-Wide Policy (Set Here)
What it is: The policy set on this page.
How it works: When
SERVICES ROUTINE ENABLEis ON, all nodes in the POD automatically inherit the parameters defined in the "Default" profiles.Purpose: Ensures consistent, baseline monitoring across your entire infrastructure.
The Exception: Individual Node Override (Set in Ch. 7.6)
Individual Node Override can be setup in Chapter 7.6 Managing Node Services
What it is: A node-specific exception to the POD-wide rule.
How it works: If you have a specific node that needs different monitoring (e.g., a critical server needing "Intensive Diagnostics"), you must:
Navigate to its
MANAGE → Node Detail → Servicestab.Go to the Subscription sub-tab.
Turn on the
INDIVIDUAL SERVICES CONFIGURATION ENABLEswitch.Select one of your other custom profiles (e.g., "Intensive Diagnostics") from the dropdown menu.
Purpose: Provides flexibility for special cases (troubleshooting, critical servers, non-critical labs) without changing the default for all other nodes.
Best Practice: The Rule, Not the Exception
Use the POD-level Default profiles (edited on this page) to define your standard monitoring policy. Use the other profiles you create here as templates for specific, temporary, or permanent individual node overrides.
Service Profile Management Strategies
Profile Design Guidelines
Naming Conventions:
Use descriptive names that indicate purpose: "Standard-Operations", "Maintenance-Intensive", "Low-Priority-Lab"
Include monitoring frequency in name: "Quick-Check-30s", "Standard-Check-300s"
Indicate environment type: "Production-Standard", "Development-Relaxed"
Parameter Optimization:
Production Critical
60-120 seconds
30 seconds
3-5 attempts
Fast detection, balanced load
Standard Operations
300 seconds
60 seconds
3 attempts
Default balanced monitoring
Development/Lab
600-1200 seconds
120 seconds
2 attempts
Minimal overhead
Maintenance Mode
30-60 seconds
15 seconds
5-10 attempts
Maximum responsiveness
Monitoring Policy Planning
Assessment Questions:
Criticality: How quickly do you need to detect issues?
Network Capacity: Can your network handle frequent monitoring traffic?
BMC Performance: Are BMCs under heavy load from other operations?
Alert Tolerance: Can you handle more frequent alerts for faster detection?
Implementation Strategy:
Start Conservative: Begin with longer intervals and adjust based on needs
Monitor Impact: Watch for BMC performance issues with aggressive monitoring
Adjust Gradually: Make incremental changes to find optimal balance
Document Changes: Keep records of profile modifications and their effects
Profile Lifecycle Management
Regular Review Process:
Quarterly Assessment: Review profile effectiveness and adjust parameters
Performance Analysis: Monitor network and BMC load from service checks
Incident Correlation: Analyze if monitoring frequency affected issue detection
Optimization: Fine-tune parameters based on operational experience
Version Control:
Document Changes: Record what changes were made and why
Test Changes: Validate new profiles in non-critical environments first
Backup Configurations: Keep records of working profile configurations
Rollback Plan: Be prepared to revert to previous configurations if needed
Chapter Summary & Key Takeaways
Profiles are Templates: Use profiles to create different "flavors" of monitoring (e.g., standard, intensive, relaxed) for different situations
Health vs. Information: BMC Health is for detecting faults, while System Information is for asset management. They serve different purposes
Activation is for the "Default": The master
SERVICES ROUTINE ENABLEswitch turns the "Default" monitoring policy on or off for the entire POD.POD-Level is the Rule: The policy you set here applies to all nodes in the POD by default. Use the Node Detail → Services page only for specific exceptions
Balance is Key: Optimize monitoring frequency to balance detection speed with system resource usage
Document Your Strategy: Maintain clear documentation of your monitoring policies and the reasoning behind parameter choices
What's Next: Chapter 13 will explore Configuring General Settings, where you'll learn to manage POD-wide operational settings and policies.
💡 Pro Tip: Start with the default profiles and adjust gradually based on your operational needs. Overly aggressive monitoring can impact BMC performance, while too relaxed monitoring may delay issue detection.