
Service (Node-level)
Chapter 7.6: Managing Node Services
Monitor the health of a node's internal management services and customize its monitoring configuration.
ℹ️ Service Monitoring
Available to: All user roles
Scope: Individual node level (individual server focus)
Permissions:
Admin roles: Full service management including configuration changes
Viewer roles: Monitor-only access to service status
Purpose: Monitor and configure Redfish service health
Overview: The Management Engine Health Check
The Services tab provides a look "under the hood" at the internal Redfish services that EDCC uses to communicate with and manage the node. Think of these services as the "management engine" running on the node's BMC.
This page allows you to perform two key tasks:
Check the Engine's Health (Status tab): If the management engine itself has a problem, the data it reports might be unreliable. This tab lets you verify that the engine is running correctly.
Fine-Tune the Engine's Behavior (Subscription tab): Customize the monitoring policy for this specific node, making it an exception to the POD-wide rule.
Communication Foundation: These services are the foundation of all EDCC-to-node communication. Issues here can affect data reliability across all other tabs.
Task 1: Diagnosing Management Service Issues
The Status sub-tab is your first stop for troubleshooting potential communication problems between EDCC and the node.
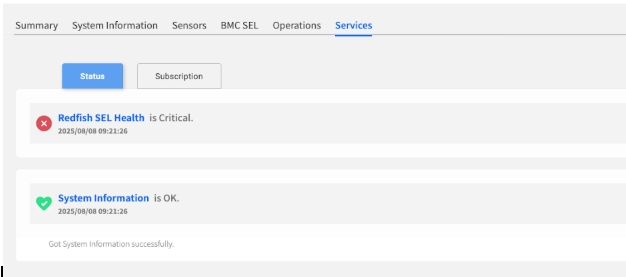
Reading the Service Health List
This list shows the real-time health of the core Redfish services. A failure here could explain why other data (like sensor readings) might not be appearing correctly in other tabs.
Each service is marked with a clear status icon:
OK (Green)
The service is running normally.
Continue monitoring.
Critical (Red)
The service has encountered an error and is not functioning correctly.
Immediate investigation required.
Service Health Impact on Other Functions:
Sensor Service Failure: May cause missing sensor data in Sensors tab.
Event Service Failure: May prevent BMC SEL updates.
Power Service Failure: May affect Operations tab power controls.
Network Service Failure: May cause general communication issues.
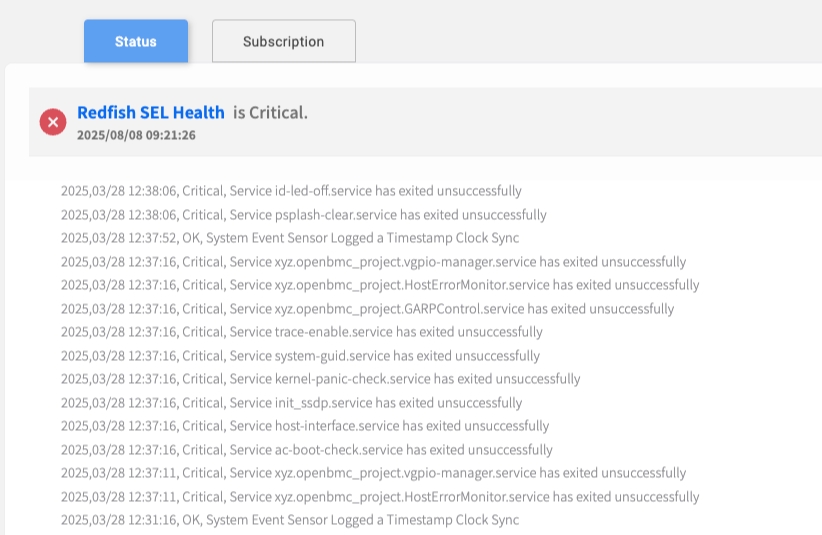
Drilling Down for Root Cause Analysis
If a service is in a Critical state, this feature allows you to immediately see the underlying hardware or software event that caused the failure.
Investigation Process:
Identify Critical Service: Look for Critical status indicators.
Expand Details: Click the dropdown arrow next to the critical service.
Review Event Logs: The view will expand to show specific, time-stamped event logs from the BMC SEL that are causing the issue.
Correlate Issues: Cross-reference with BMC SEL tab for complete context.
Root Cause Analysis Workflow:
Service Critical Status → Expand Details → Review Events → Check BMC SEL → Plan ResolutionTask 2: Customizing Monitoring for a Specific Node
The Subscription sub-tab allows you to apply a unique monitoring configuration to this node.
Admin Permission Required: Service configuration changes require POD Admin or Organization Admin role.
Why Would I Customize a Single Node?
While it's best practice to maintain a consistent policy at the POD level, you may have specific nodes that require special treatment.
Reducing Alert Noise
Non-critical node with known issue.
Disable specific service checks to stop unnecessary alerts.
Lowering Impact
Sensitive production server.
Apply Service Profile with longer polling interval to reduce management traffic.
Aiding Troubleshooting
Problematic node diagnosis.
Apply more aggressive Service Profile to diagnose connectivity issues.
Maintenance Mode
Node undergoing maintenance.
Temporarily disable non-essential monitoring.
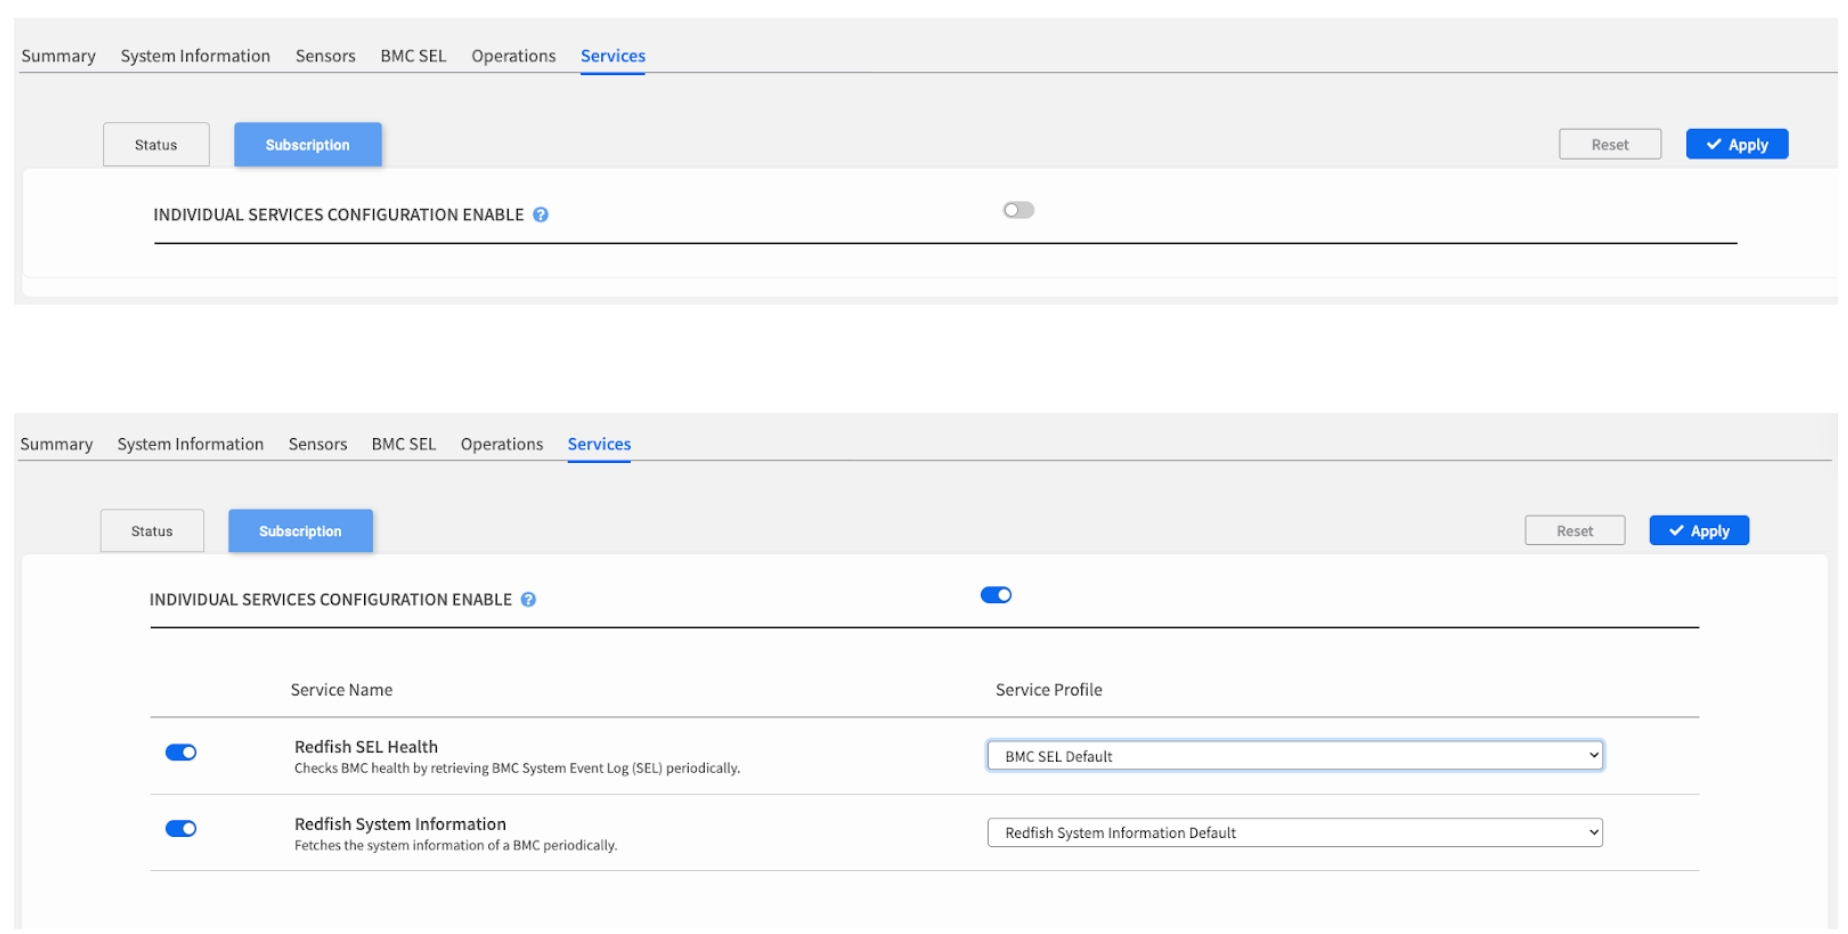
How to Override the POD Policy
By default, a node inherits its monitoring settings from the POD. To apply custom settings, you must explicitly enable the override.
Step-by-Step Configuration:
Navigate to
SubscriptionSub-tab: Click the Subscription tab within Services.Enable Override: Turn on the master INDIVIDUAL SERVICES CONFIGURATION ENABLE switch.
Choose Your Configuration Method: Once enabled, you have two ways to configure the node:
Option A: Apply a Service Profile: Select a pre-defined monitoring template (e.g., "Intensive Monitoring" or "Standard") from the Service Profile dropdown menu. This applies a consistent set of toggles.
Option B: Manually Configure: Use the individual toggles next to each service to enable or disable them one by one. This is for highly specific, one-off exceptions.
Save Changes: Click the Apply button in the top-right corner to save your changes.
Configuration Options:
Individual Service Toggles: Enable/disable specific Redfish services.
Service Profile Selection: Choose from pre-defined monitoring profiles.
Polling Intervals: (Set within the selected Service Profile) Adjusts frequency of service health checks.
Alert Thresholds: (Set within the selected Service Profile) Modifies service-specific alert criteria.
Service Management Best Practices
Consistent Management Strategy
Best Practice: Use Overrides Sparingly
Individual overrides are powerful but can make management more complex. For consistent monitoring, always try to manage service configurations at the POD level (via the Node List bulk operations) whenever possible.
Management Hierarchy:
POD Level (Preferred): Use bulk operations for consistent policies.
Group Level: Apply to logical groups of similar nodes.
Individual Level (This Page): Only for exceptional cases requiring unique treatment.
When to Use Individual Overrides
Recommended Scenarios:
Temporary Troubleshooting: Short-term diagnostic configurations.
Hardware-Specific Issues: Nodes with unique hardware limitations.
Maintenance Periods: Temporary monitoring adjustments during service.
Testing New Profiles: Pilot new configurations before POD-wide deployment.
Avoid Individual Overrides For:
Routine Configuration: Use POD-level management instead.
Similar Node Groups: Create consistent groups rather than individual settings.
Permanent Changes: Consider updating POD policy instead.
Monitoring Configuration Guidelines
Service Profile Selection:
High Frequency: For critical nodes requiring immediate issue detection.
Standard Frequency: Default for most production nodes.
Low Frequency: For non-critical nodes or to reduce network overhead.
Maintenance Mode: Minimal monitoring during planned maintenance.
Service Toggle Strategy:
Critical Services: Keep enabled unless absolutely necessary to disable.
Optional Services: Disable for nodes that don't require specific capabilities.
Diagnostic Services: Enable temporarily for troubleshooting.
Resource-Intensive Services: Disable on resource-constrained nodes.
Chapter Summary & Key Takeaways
Status is for Diagnosis: Use the Status tab to confirm that the node's internal management engine is healthy.
Subscription is for Exceptions: Use the Subscription tab to create a specific monitoring policy for a single node that needs to be an exception to the POD-wide rule.
Enable the Override: No individual subscription settings can be changed until the master "INDIVIDUAL SERVICES CONFIGURATION ENABLE" switch is turned on.
Manage Centrally When Possible: For consistency, it's always better to manage service profiles for groups of nodes using the bulk operations on the Node List page.
Admin Rights for Configuration: Service configuration changes require Admin permissions - Viewers can monitor but cannot modify settings.
Foundation for Reliability: Service health directly impacts the reliability of all other EDCC management functions.
What's Next:
Chapter 8 will explore POD-level service monitoring, where you'll learn to monitor service health across your entire infrastructure scope.
💡 Pro Tip: Always check service health first when troubleshooting unusual behavior in other EDCC functions - service failures often explain data inconsistencies or missing information.