
Node Detail Page
In-Depth Node Management (Node Detail)
Your complete guide to the Node Detail page—the central cockpit for monitoring, managing, and troubleshooting an individual node.
ℹ️ Individual Server Management
Available to: All user roles
Scope: POD level (individual server focus)
Permissions:
POD/Org Admin: Full control including Operations tab
Viewer roles: Monitor-only (Summary, System Info, Sensors, BMC SEL tabs)
Access Method: Select node from Node List → click Details or use individual node action menu
Overview: The Cockpit for a Single Node
After selecting a node from the Node List, you arrive at the Node Detail page. Think of this as the command center or "cockpit" for that specific machine.
You'll come here when you need to move beyond a high-level overview and perform a deep-dive investigation or a specific management action. Whether you're troubleshooting a hardware alert, checking a component's exact part number, or remotely rebooting the node, this is where you'll find the right tool for the job.
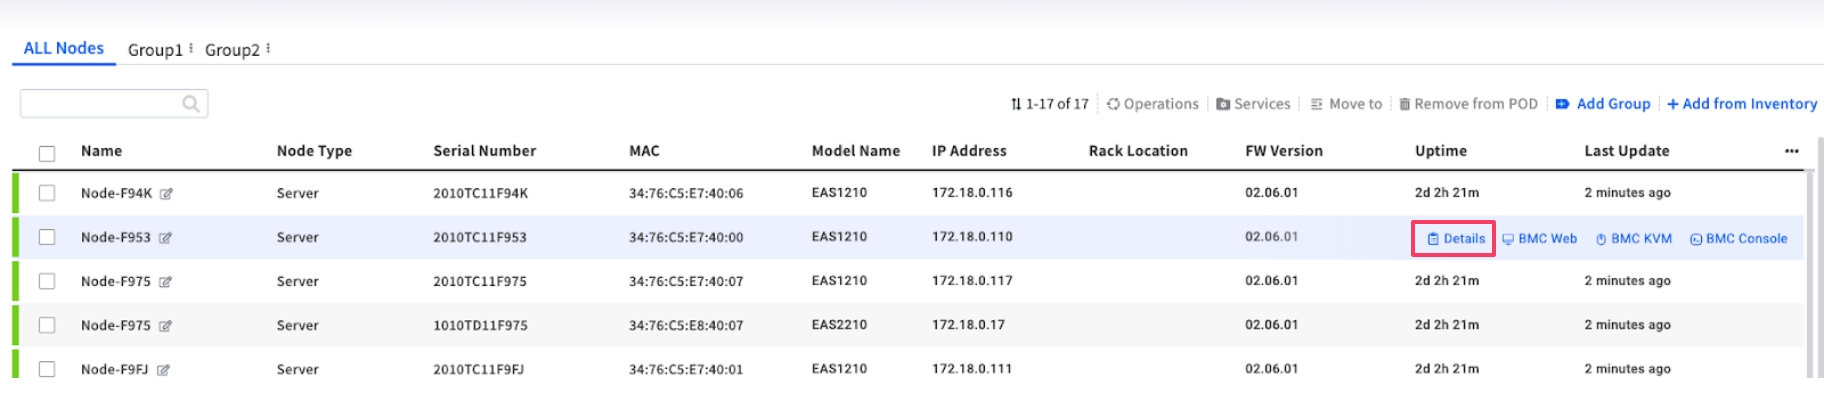
Navigation Context: Access this page by selecting a specific node from the Node List and clicking Details or using the individual node action menu (...).
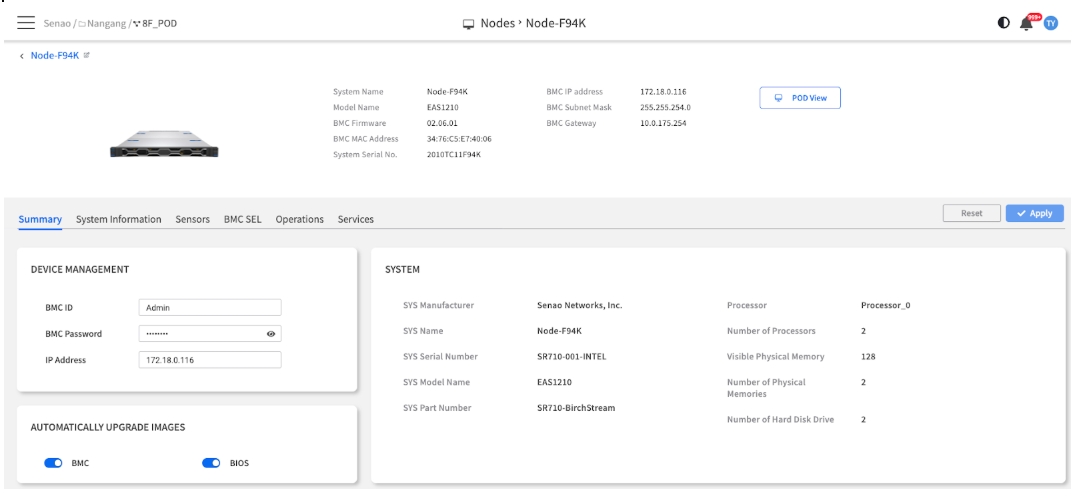
Which Tab Should I Use? A Quick Reference Guide
The Node Detail page is organized into six specialized tabs, each designed for specific tasks. Use this table as your quick navigation guide to find the right tool for your immediate needs.
Get a quick health overview and see live sensor graphs
Real-time status dashboard
Identity verification, live sensor charts, basic configuration
Find exact part numbers for memory DIMM, CPU, or power supply
Complete hardware inventory
Detailed component specifications, serial numbers, part numbers
Check detailed sensor readings and verify warning/critical thresholds
Precise environmental monitoring
Real-time sensor values, threshold comparisons, status indicators
Investigate hardware alerts and see what the BMC recorded
Hardware event investigation
Event logs, resolution tracking, alert correlation
Execute direct hardware control like remote reboot or firmware updates
Direct BMC command execution
Power control, firmware updates, maintenance operations
Monitor management services or customize monitoring policies
Redfish service health management
Service status monitoring, configuration overrides
Important Concepts for Node Detail Management
Data Refresh Requirements
Manual Refresh Required: Most tabs display snapshot data from page load. For real-time information, perform manual browser refresh (F5) to get latest BMC readings.
Permission-Based Functionality
Configuration Changes: Require POD Admin or Organization Admin role
Read-Only Access: Available to all user roles for monitoring purposes
Operations Tab: Completely restricted to Admin roles due to high-risk nature
BMC-Centric Management
All Node Detail functions communicate directly with the server's BMC via Redfish protocol, providing:
Out-of-band Control: Independent of OS status
Hardware-Level Access: Direct component monitoring and control
Real-time Data: Live sensor readings and event logging
What's Next : This chapter serves as the introduction to a comprehensive six-part series. Each sub-chapter provides detailed, step-by-step instructions for mastering a specific aspect of individual node management.
Please proceed to Chapter 7.1: Summary Tab to begin your deep dive into individual node management.
💡 Pro Tip: Bookmark the tab reference table above - it's your fastest way to navigate directly to the right tool for any node management task!