
Dashboard
Chapter 5:Using the Dashboard
Your central hub for at-a-glance monitoring and a launchpad for investigating issues.
ℹ️ Dashboard Access
Available to: All user roles (Organization Admin, POD Admin, POD Viewer)
Scope: Organization, Hierarchy View, POD levels
Permissions: Monitor-only for all roles
Overview: Your Daily Operations Cockpit
The Dashboard is your primary starting point for daily operations. Think of it as the main cockpit of your infrastructure, providing a high-level, real-time overview of your environment's health. Its purpose is to help you answer one question very quickly: "Is everything okay, or does something need my immediate attention?"
It's designed to be an interactive launchpad. The widgets not only show you information but also act as direct shortcuts, allowing you to jump from a high-level alert straight to the detailed page needed to investigate it.
Critical Note: The Dashboard is a Snapshot
The data on the Dashboard is a snapshot from when the page was loaded. It does not auto-refresh. To get the most up-to-the-minute status from the node BMCs, you must perform a manual browser refresh (F5).
Understanding Scope Impact on Dashboard
What You See Depends on Your Selected Scope:
Organization Level: Displays aggregated data from all PODs you have access to
Hierarchy View Level: Shows data only from PODs within that HV that you can access
POD Level: Displays data specifically from the selected POD
Permission Filtering: The dashboard automatically filters content based on your role and authorized PODs. For example, if you have access to POD1 and POD3 but not POD2, selecting "Organization" will show combined data from POD1+3 only.
Your 60-Second Daily Health Check
Workflow: Incorporate this simple routine into your daily operations for efficient infrastructure management.
1. Select Scope → 2. Check Health → 3. Investigate Issues → 4. Navigate to DetailsStep-by-Step Process:
Select Your Scope: Use the hamburger menu to choose the Organization, HV, or specific POD you want to check from the Management Tree.
Check POD Health First: The POD Health widget is your most critical indicator. Its color, status, and node count tell you if immediate action is required.
Investigate Alerts: If the status shows node counts with CRITICAL or WARNING, click the widget. This is your shortcut to jump directly to the Services page to see which specific nodes need attention.
Review Resource Trends: Quickly scan the resource distribution and historical trends for any anomalies.
Understanding Rack Management
The Rack count in your Dashboard requires manual setup:
Initial State: New PODs show "0" racks even if physical racks exist in your data center
Creating Logical Racks: Navigate to
MANAGE → PODView to create and define racksAssigning Nodes: Drag nodes into rack positions in POD View
Dashboard Update: Once nodes are placed in racks, the Dashboard will reflect your logical rack count
Remember: Rack management in EDCC is a planning and documentation tool. It doesn't automatically detect physical rack arrangements.
Interpreting the Dashboard Widgets
Overview: Each widget on the Dashboard provides a specific piece of information and often serves as a direct link to a more detailed page.
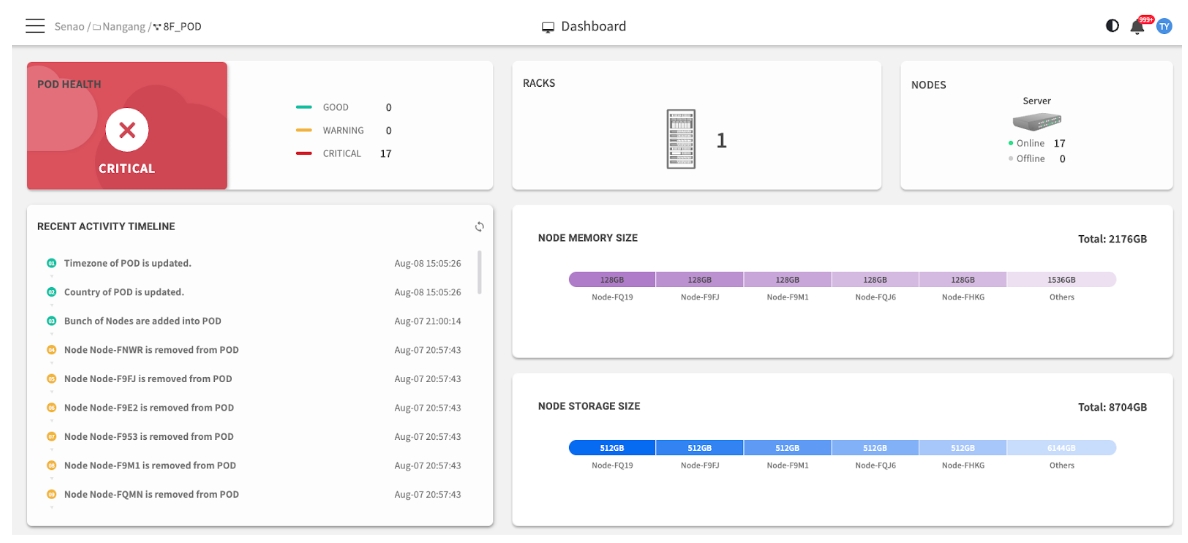
Primary Monitoring Widgets
POD Health
An immediate, color-coded health summary showing the number of nodes with unresolved Critical or Warning events from their BMC SELs.
Clicking the status takes you directly to the Services page, pre-filtered to show the specific nodes reporting issues.
🔴 HIGHEST
Racks & Nodes
A quick inventory count showing:
• Nodes: Total nodes in this POD with Online vs. Offline breakdown
• Racks: Number of logical racks created in POD View (only counted when nodes are assigned to racks)
Clicking the Nodes count navigates directly to the Node List for detailed view.
🟡 HIGH
Note on Rack Count: The Rack number only appears after you've organized nodes into racks using MANAGE → POD View. This is a logical organization feature, not automatic physical detection.
Capacity Planning Widgets
Resource Distribution
A visual breakdown of the total installed capacity of Memory and Storage across your nodes. This is for capacity planning, not real-time usage.
(No link) Read-only informational chart.
Planning Tool
Historical & Audit Widgets
Recent Activity Timeline
A log of the most recent administrative actions performed in EDCC, such as configuration changes or firmware updates.
(No link) Read-only audit log.
Audit Trail
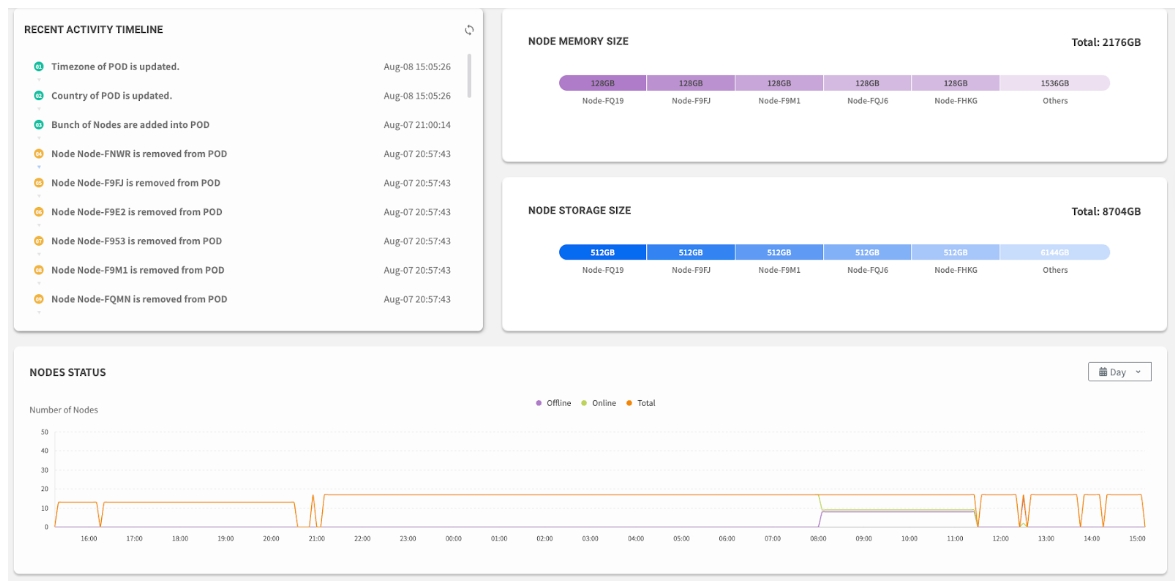
Nodes Status History
A historical line graph tracking the number of online and offline nodes over time. Useful for identifying trends or pinpointing outage timing.
(No link) Read-only historical chart.
Trend Analysis
Dashboard Status Indicators
POD Health Status Meanings
GOOD
🟢 Green
No nodes have critical or warning events
No number displayed
WARNING
🟡 Yellow
One or more nodes have warning-level events
Number of nodes with warnings (e.g., "2 WARNING" = 2 nodes have warnings)
CRITICAL
🔴 Red
One or more nodes have critical events
Number of nodes with critical issues (e.g., "3 CRITICAL" = 3 nodes need attention)
Important: The number shown represents affected nodes, not event count. For example, "3 CRITICAL" means 3 servers have critical issues, regardless of how many events each server has. Click the widget to see which specific nodes need attention.
Understanding Node Counts vs. Event Counts
What you'll see:
Dashboard POD Health: Shows node count (e.g., "3 CRITICAL")
Services Page: Shows the actual nodes that are in critical state
BMC SEL: Shows the detailed events causing the critical status
Example Scenario:
Dashboard shows: "2 CRITICAL"
This means: 2 nodes in your POD have critical issues
Services page will show: Those 2 specific nodes with their issues
Each node might have multiple critical events in its BMC SEL
Troubleshooting Dashboard Issues
Common Dashboard Problems
⁉️ Problem: "I don't see any rack count"
Cause: Nodes haven't been organized into racks in POD View
Solution: Navigate to MANAGE → POD View and organize your nodes into logical racks
⁉️ Problem: "I don't see all my servers"
Cause: Scope filtering or permission limitations
Solution: Check your selected scope in the header and verify your POD access permissions
⁉️ Problem: "Dashboard shows outdated information"
Cause: Dashboard doesn't auto-refresh
Solution: Press F5 to manually refresh and get latest BMC data
⁉️ Problem: "Resource numbers seem wrong"
Cause: Resource charts show installed capacity, not current usage
Solution: This is expected behavior - these are planning tools, not utilization monitors
⁉️ Problem: "POD Health shows a number but I'm not sure what it means"
Cause: Misunderstanding of node count vs. event count
Solution: The number represents how many nodes have issues, not how many issues exist. Click through to Services page for details
Dashboard Quick Reference
Widget Priority Guide
First Check: POD Health (any critical/warning node counts?)
Second Check: Nodes status (any offline nodes?)
Third Check: Recent Activity (any recent changes that might affect operations?)
Fourth Check: Historical trends (any patterns emerging?)
Navigation Shortcuts from Dashboard
POD Health with issues
Click the status
Services page (filtered to problem nodes)
Nodes count
Click the number
Node List (all nodes in POD)
Offline node indicator
Click through to Node List
Node List (can filter by status)
Chapter Summary & Key Takeaways
Essential Dashboard Concepts:
It's a Launchpad: Use widgets as shortcuts to jump directly to problem areas
Node Counts, Not Events: POD Health shows how many nodes have issues, not how many issues exist
Rack Organization is Manual: Rack counts require organizing nodes in POD View first
Health is Driven by SEL: The POD Health status is determined by unresolved events in the BMC SEL. To clear a critical alert, you must resolve the corresponding hardware events
Refresh is Required: The data is a snapshot. Always manually refresh (F5) your browser to get the latest status
Capacity, Not Usage: The resource charts show total installed hardware capacity, not real-time utilization
Scope Matters: What you see depends on your selected management scope and permissions
What's Next: Chapter 6 will dive deeper into the Node List, where you'll learn to manage individual servers and perform bulk operations across your infrastructure.
💡 Pro Tip: Bookmark the Dashboard as your EDCC starting point and develop a habit of checking POD Health first thing each morning. Remember that the numbers show affected nodes - if you see "3 CRITICAL", you know exactly 3 servers need your attention!